
Description
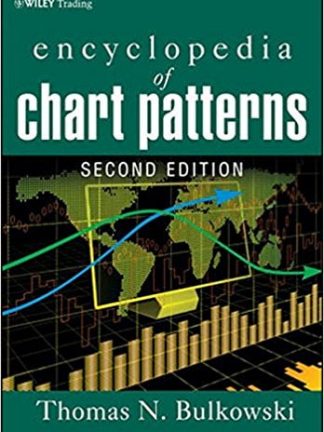
Book : Encyclopedia of Chart Patterns Second Edition
Encyclopedia of Chart Patterns First Edition
Review
“The book is called an ‘Encyclopedia’ for a reason. In roughly 1000 pages, it contains 53 chart patterns plus 9 more event patterns which will pretty much cover you for any chart you come across…. if you take technical trading seriously, it is a book that should be on your shelf.”
—Alan Battista, Stockineer.com Book Review
From the Inside Flap
The Encyclopedia of Chart Patterns, recognized as the premier reference on chart pattern analysis, extends its lead with this Second Edition. This definitive text includes new bull and bear market statistics, performance sorted by volume shape and trend, more than a dozen additional chart patterns, and a new section covering ten event patterns. Significant events—such as earnings announcements, stock upgrades and downgrades—shape today’s trading, and Bulkowski gives readers the best information on what happens after those events occur. He also shows you how to trade them and uses reliable statistics to back it all up.
In each chapter of Encyclopedia of Chart Patterns, Second Edition you’ll learn the following about each pattern:
- Results Snapshot—A statistical summary of pattern behavior, including its performance rank, breakeven failure rate, average rise or decline—all separated by breakout direction and market type (bull or bear)
- Tour—A broad introduction to the pattern
- Identification Guidelines— Characteristics to look for
- Focus on Failures—What failed patterns look like, why they failed, and how to avoid them
- Statistics—The numbers and what they tell you, separated into bull/bear markets and breakout direction, including average rise or decline, failure rates, volume shapes, performance by size, and busted pattern performance
- Trading Tactics—Strategies to increase profits and minimize risk
- Sample Trade—Puts it all together, showing the chart pattern in action, with hypothetical or actual trades using real data
- For Best Performance—A table of selection tips to boost performance
Encyclopedia of Chart Patterns, Second Edition also includes summary tables ranking chart- and event-pattern performance for easy reference; a glossary; a chapter on methodology explaining what each statistical table entry means and how it was calculated; and a visual index to make chart pattern identification a snap.
The result is today’s most comprehensive and valuable technical analysis reference—one that will save you critical time in identifying chart patterns and increase your likelihood of buying near the price bottom and selling near the top.


Reviews
There are no reviews yet.